 Guest
Guest
Chapter:
Organisms-and-Populations
The given graph represents fastest multiplication rate of bacteria when y are added to rich broth.
The following graphs represent bacterial growth under different conditions, with increasing numbers of bacteria on -axis and increasing time on -axis.
Which graph describes result of introduction of minimal nutrients for first six hours and n addition of surplus nutrients?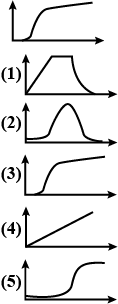
The given graph represents fastest multiplication rate of bacteria when y are added to rich broth.
The following graphs represent bacterial growth under different conditions, with increasing numbers of bacteria on -axis and increasing time on -axis.
The following graphs represent bacterial growth under different conditions, with increasing numbers of bacteria on -axis and increasing time on -axis.
Which graph describes result of introduction of minimal nutrients for first six hours and n addition of surplus nutrients?
All Chapters
View all Chapter and number of question available From each chapter from Biology-MCQS
The Living World
Biology mcqs
Biological Classification
Biology mcqs
Plant Kingdom
Biology mcqs
Animal Kingdom
Biology mcqs
Morphology of Flowering Plants
Biology mcqs
Anatomy of Flowering Plants
Biology mcqs
Structural Organisations in Animals
Biology mcqs
Cell : The Unit of Life
Biology mcqs
Biomolecules
Biology mcqs
Cell Cycle and Cell Division
Biology mcqs
Transport in Plants
Biology mcqs
Mineral Nutrition
Biology mcqs
Photosynthesis in Higher Plants
Biology mcqs
Respiration in Plants
Biology mcqs
Plant Growth and Development
Biology mcqs
Digestion and Absorption
Biology mcqs
Breathing and Exchange of Gases
Biology mcqs
Body Fluids and Circulation
Biology mcqs
Excretory Products and Elimination
Biology mcqs
Locomotion and Movement
Biology mcqs
Neural Control and Coordination
Biology mcqs
Chemical Control and Coordination
Biology mcqs
Reproduction in Organisms
Biology mcqs
Sexual Reproduction in Flowering Plants
Biology mcqs
Human Reproduction
Biology mcqs
Reproductive Health
Biology mcqs
Principles of Inheritance and Variation
Biology mcqs
Molecular Basis of Inheritance
Biology mcqs
Evolution
Biology mcqs
Human Health and Disease
Biology mcqs
Strategies for Enhancement in Food Production
Biology mcqs
Microbes in Human Welfare
Biology mcqs
Biotechnology Principles and Processes
Biology mcqs
Biotechnology and its Applications
Biology mcqs
Organisms and Populations
Biology mcqs
Ecosystem
Biology mcqs
Biodiversity and Conservation
Biology mcqs
Environmental Issues
Biology mcqs
Similar Question
This Chapter Organisms-and-Populations consists of the following topics
The population growth represented by graph shows</h2><div class="Question_backgroundImg__6PgwQ"><img loading="lazy" src="./images/481352_7b805af2f108423588a5ff1548284107.png" class="Question_questionImage__Ib90R" alt="image"></div></div>
The given graph represents fastest multiplication rate of bacteria when y are added to rich broth.
The following graphs represent bacterial growth under different conditions, with increasing numbers of bacteria on -axis and increasing time on -axis.
Which graph describes result of introduction of minimal nutrients for first six hours and n addition of surplus nutrients?
The following graphs represent bacterial growth under different conditions, with increasing numbers of bacteria on -axis and increasing time on -axis.
